Essential Commercial Real Estate Formulas Every Investor Should Know
For institutional investors, family offices, and high-net-worth individuals, precise financial modeling is critical to strategic real estate decision-making. Understanding foundational commercial real estate (CRE) formulas empowers you to evaluate deals confidently, manage risk effectively, and project long-term returns with clarity.
At Trinity Real Estate, we apply these metrics across our advisory, asset management, and transaction services to ensure every investment aligns with your capital goals.
Why These Formulas Matter
Understanding these commercial real estate KPIs helps you:
- Evaluate real estate investment opportunities accurately
- Compare assets across markets and property types
- Enhance due diligence during acquisition or refinance
- Optimize deal structures for long-term wealth preservation
Break-Even Ratio (BER)
Description
The Break-Even Ratio (BER) is a risk assessment metric that shows what percentage of gross operating income (GOI) is required to cover operating expenses and debt service. It measures how much rental income is needed for a property to avoid operating at a loss.
Use Case
BER is used by real estate investors, lenders, and underwriters to:
- Assess a property’s financial stability under stress
- Evaluate cash flow resiliency in the face of vacancies or rent reductions
- Set loan risk thresholds for acquisitions and refinances
A lower BER means more margin for error, ideal for lenders and conservative investors.
Formula:
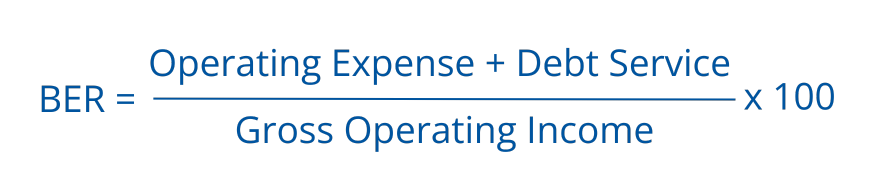
Where:
- Operating Expenses: Includes recurring costs like taxes, insurance, repairs, and property management
- Debt Service: Annual loan payments, including both principal and interest
- Gross Operating Income (GOI): Total income before expenses — includes base rents, reimbursements, and other property income streams
Example:
- Operating Expenses: $60,000
- Debt Service: $40,000
- GOI: $120,000
- BER = 83.33%

What It Means:
A BER of 83.33% means the property must collect at least 83.33% of its total gross income to avoid a negative cash flow.
- Lower BER = More cushion for tenant turnover, rent drops, or delays
- Higher BER = Less buffer and higher risk of default or operational strain
Typical benchmarks:
- ≤ 80%: Low risk
- 80%–85%: Moderate risk
- > 85%: Elevated risk; often scrutinized by lenders
Pro Tip
While BER is simple, it’s not a performance metric, it’s a risk indicator. Use it alongside DSCR, NOI, and vacancy sensitivity analysis to understand your asset’s break-even pressure points.
Capitalization Rate (Cap Rate)
Description
The Capitalization Rate (Cap Rate) is one of the most important commercial real estate valuation metrics. It calculates the unleveraged annual return on a property based on its Net Operating Income (NOI) relative to its market value. It is expressed as a percentage.
Use Case
Cap Rate is a foundational benchmark used by real estate investors, appraisers, and underwriters to:
- Evaluate the income-generating potential of a property
- Compare the relative value across assets, property types, and markets
- Assess whether a property is priced attractively based on its stabilized income
Used in both acquisitions and disposition pricing, it’s a core component of every real estate underwriting model.
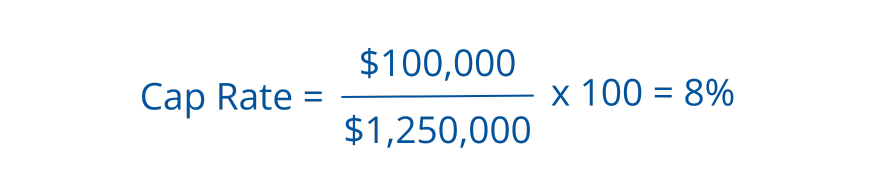
Formula:

Where:
- Net Operating Income (NOI): Income after operating expenses, before debt service or taxes.
- Property Value: Typically, the market price or appraised value based on current conditions.
Example:
- NOI: $100,000
- Property Value: $1,250,000
- Cap Rate = 8%
What It Means:
Cap Rate tells you the annual return on investment you’d earn if you bought the property in cash, based solely on existing income.
- Higher Cap Rate = Higher income yield (but may reflect higher risk or weaker market)
- Lower Cap Rate = Lower yield, often tied to premium locations, stabilized tenants, or stronger asset quality
It’s most useful for comparing stabilized properties across regions or sectors (e.g., office vs industrial vs multifamily).
Pro Tip
Cap Rate is not a growth metric, it reflects current income, not future upside. Always pair it with metrics like Yield on Cost and IRR when underwriting development or repositioning strategies.
Cash-on-Cash Return (CoC)
Description
Cash-on-Cash Return measures the annual pre-tax cash flow a real estate investment generates relative to the actual cash invested. Expressed as a percentage, this metric focuses solely on the equity portion of an investment, making it highly relevant for investors evaluating leverage and income yield.
Use Case
Cash-on-Cash Return is used to:
- Evaluate the efficiency of equity deployment
- Compare leveraged vs. unleveraged returns
- Assess passive income potential from stabilized assets
- Benchmark returns across properties, especially in income-focused portfolios
It’s one of the most relied-upon metrics for passive investors, syndications, and real estate funds.
Formula:
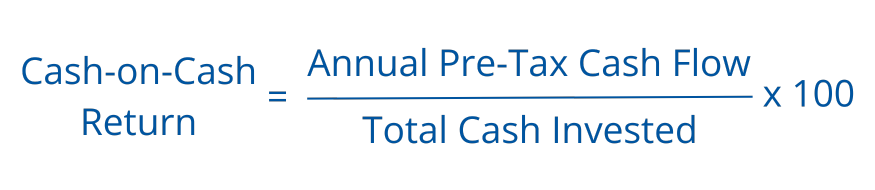
Where:
- Annual Pre-Tax Cash Flow: Net Operating Income (NOI) minus annual debt service (principal + interest)
- Total Cash Invested: Includes down payment, closing costs, and any upfront capital for renovations or improvements
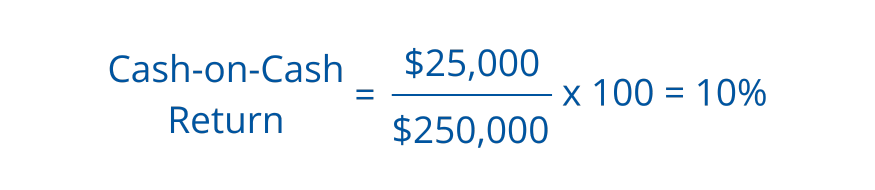
Example:
- Annual Cash Flow = $25,000
- Total Cash Invested = $250,000
- Cash-on-cash Return = 10%
What It Means:
Cash-on-Cash Return tells you the real cash yield you’re earning on your invested capital — before taxes and appreciation:
- High CoC Return = Strong income generation relative to equity
- CoC is cash-focused, not total-return focused (it excludes appreciation or future sale value)
- Ideal for evaluating the income performance of leveraged deals
Pro Tip
Use CoC Return alongside IRR, Equity Multiple, and Yield on Cost to build a full investment picture. While CoC is useful for year-one analysis, it doesn’t account for timing of cash flows or exit gains.
Debt Service Coverage Ratio (DSCR)
Description
The Debt Service Coverage Ratio (DSCR) is a key underwriting and risk metric in commercial real estate that measures a property’s ability to cover its debt obligations using its Net Operating Income (NOI). It tells lenders and investors whether a property produces enough income to safely support its loan payments.
Use Case
DSCR is a fundamental ratio in loan underwriting and asset management. It is used to:
- Evaluate a property’s debt repayment capacity
- Determine loan sizing and risk thresholds
- Ensure adequate income cushion during downturns or vacancies
- Satisfy lender requirements during acquisition or refinancing
A DSCR of 1.2 or higher is typically required by banks and institutional lenders for stabilized income-producing properties.
Formula:

Where:
- NOI: Net Operating Income, calculated as gross rental income minus operating expenses (excluding debt, taxes, and depreciation)
- Total Debt Service: Total annual loan payments, including both principal and interest
Example:
- NOI = $120,000
- NOI = $120,000

What It Means:
DSCR tells you how many times a property’s income can cover its debt payments:
- DSCR > 1.0: The property generates more than enough income to cover debt
- DSCR = 1.0: The property breaks even — all income goes to debt payments
- DSCR < 1.0: The property generates insufficient income, which signals negative cash flow risk and potential default concerns
Lenders prefer higher DSCRs to ensure a margin of safety. For example, a DSCR of 1.25 means the NOI covers 125% of annual debt obligations.
Pro Tip
DSCR plays a major role in loan approval, refinance risk, and asset risk ratings. In volatile or rising interest rate environments, maintain DSCR buffers through lease management and operating cost control.
Effective Gross Income (EGI)
Description
Effective Gross Income (EGI) represents the total income a property is expected to generate after accounting for vacancy losses and other non-rent revenue sources. It’s a realistic projection of revenue before operating expenses, used as a foundation for further financial modeling.
Use Case
EGI is a core metric in real estate underwriting, appraisal, and valuation. It is used to:
- Reflect adjusted rental income after factoring in normal vacancy and tenant turnover
- Include additional income streams (laundry, parking, vending, etc.)
- Serve as the starting point for calculating Net Operating Income (NOI)
- Compare income assumptions across properties or portfolios
EGI provides a more accurate view of revenue than Potential Gross Income alone.
Formula:
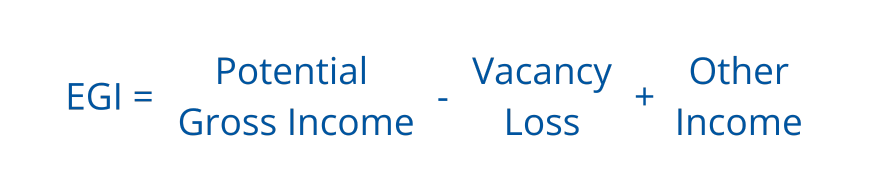
Where:
- Potential Gross Income (PGI:) Income if all units are 100% leased at market or contract rent
- Vacancy & Credit Loss: Estimated loss from tenant turnover, vacancy, or missed payments
- Other Income: Non-rental income such as parking, storage, laundry, utility reimbursements, or amenities
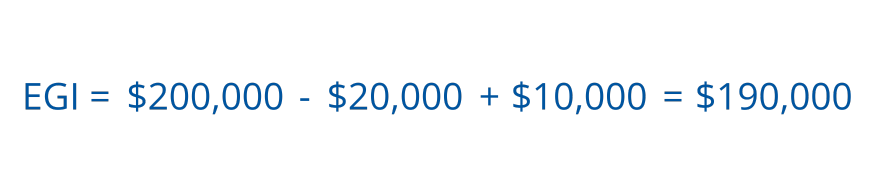
Example:
- PGI = $200,000
- Vacancy & Credit Loss = $20,000
- Other Income = $10,000
- ECI = $190,000
What It Means:
EGI shows how much income you can reasonably expect to collect from a property:
- It’s more conservative than PGI, accounting for real-world leasing performance
- It’s a critical step before calculating NOI, DSCR, and Cap Rate
- Higher EGI usually reflects stabilized occupancy and diversified income streams
Pro Tip
When underwriting, keep your vacancy assumptions realistic based on market comps and tenant retention. Overestimating EGI can lead to overvalued assets and weak DSCR.
Gross Operating Income (GOI)
Description
Gross Operating Income (GOI) represents the adjusted rental income a property is expected to generate after accounting for vacancy and credit loss, but before other income sources. It reflects a property’s core rental revenue potential in real-world conditions.
Use Case
GOI is used by investors, underwriters, and appraisers to:
- Project realistic rental income under typical market vacancy assumptions
- Build up to Effective Gross Income (EGI) in pro forma modeling
- Analyze rental performance of income-generating properties
- Support valuation, DSCR, and NOI calculations during underwriting
Formula:

Where:
- Potential Gross Income (PGI): Total rental income if the property is 100% leased at market or in-place rents
- Vacancy and Credit Loss: Estimated income loss due to unoccupied space or non-paying tenants (typically a % of PGI)
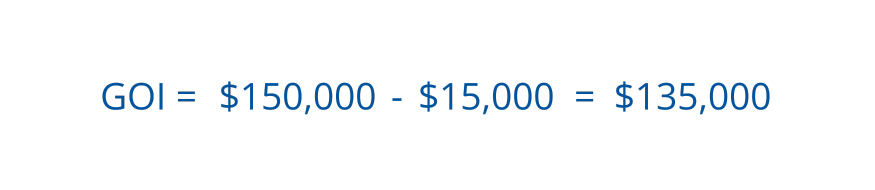
Example:
- PGI = $150,000
- Vacancy & Credit Loss = $15,000
- GOI = $135,000
What It Means:
GOI helps you understand how much rental revenue a property is likely to produce, assuming realistic leasing conditions:
- It accounts for expected downtime, turnover, or tenant delinquency
- GOI is a precursor to EGI, which adds non-rent income (e.g., parking, storage)
Pro Tip
Vacancy rates vary by asset class and location. Use market-specific vacancy assumptions when calculating GOI and validate them against market studies or leasing comps.
Gross Rent Multiplier (GRM)
Description
Gross Rent Multiplier (GRM) is a quick property valuation ratio that compares a property’s price to its gross annual rental income. It estimates how many years of income it would take to pay off the purchase price, excluding expenses, debt, and taxes.
Use Case
GRM is often used by:
- Investors screening income-generating properties
- Brokers comparing relative value across similar assets
- Analysts assessing potential over- or undervaluation in a market
It’s best suited for initial screening and market comps, not for detailed underwriting.
Formula:
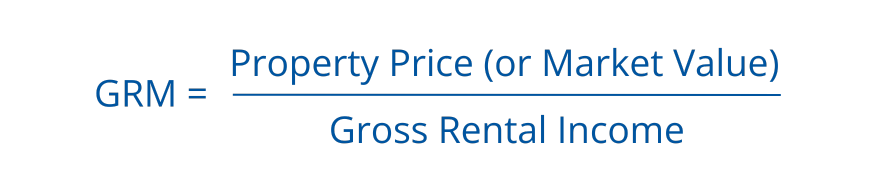
Where:
- Property Price: The listed or sale price of the property
- Gross Annual Rental Income: Total expected rent for one year, before expenses, vacancy, or any deductions
Example:
- Property Price: $500,000
- Gross Rental Income (annual): $50,000
- GRM = 10

What It Means:
- A GRM of 10 means you’re paying 10 times the property’s gross annual rental income.
- Lower GRMs generally suggest better value, but the metric does not account for operating costs, location risk, or tenant quality. Always pair GRM with more detailed metrics like Cap Rate or NOI for complete insight.
Pro Tip
GRM varies significantly by market and property type. For example, Class A urban assets might have GRMs of 15–20, while secondary market properties could range from 6–10. Use GRM for relative comparison, not absolute valuation.
Internal Rate of Return (IRR)
Description
The Internal Rate of Return (IRR) is a time-weighted investment metric that estimates the total annualized return on a real estate project. It represents the discount rate at which the Net Present Value (NPV) of all future cash flows equals zero.
In simple terms, IRR tells investors the rate of growth an investment is expected to generate over time.
Use Case
IRR is a core metric used in real estate private equity, development, and fund management to:
- Compare projects with different holding periods or cash flow timing
- Evaluate long-term return potential
- Model exit strategies, lease-up curves, and refinance scenarios
It’s a critical tool when weighing value-add, ground-up, or multi-year investment strategies.
Formula:

Where:
- Ct = Net cash inflow during period t
- C0 = Initial investment (a negative number, cash outflow)
- t = Time period (1, 2, …, n)
- n = Total number of time periods
- IRR = The discount rate that makes the Net Present Value = 0
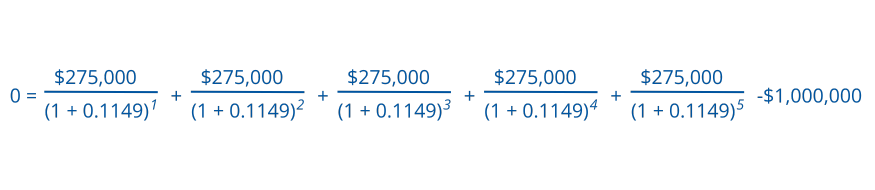
Example:
- Initial Investment (C₀): –$1,000,000
- Annual Cash Flows (C₁ through C₅): $275,000
- Time periods (n): 5
- IRR ≈ 14.49% or 0.1449
What It Means:
IRR reflects the total expected return over the entire hold period, accounting for:
- The timing of cash flows (early income is worth more)
- Reinvestment of earnings at the IRR rate
- The full investment lifecycle — from acquisition to exit
A higher IRR typically means a project generates more value in less time, though high IRRs can also signal higher risk or aggressive assumptions.
Pro Tip
Use IRR in combination with Net Present Value (NPV) and Equity Multiple to get a well-rounded view of an investment’s performance. While IRR is powerful, it can be misleading if used alone; especially when cash flows are irregular or negative in later years.
Loan-to-Value Ratio (LTV)
Description
The Loan-to-Value Ratio (LTV) is a core financing metric in real estate that compares the amount of a loan to the value of the property being financed. It measures the degree of leverage used in an acquisition or refinance and is a critical factor in underwriting and loan approval.
Use Case
LTV is used by lenders, investors, and underwriters to:
- Assess credit risk and determine maximum loan proceeds
- Evaluate borrower equity contribution
- Benchmark against lender guidelines (e.g., bank, agency, CMBS)
- Set terms for interest rates, recourse, and loan covenants
A lower LTV typically signals lower default risk and higher borrower commitment.
Formula:

Where:
- Loan Amount: Total borrowed amount (including senior, mezzanine, or construction debt, if applicable)
- Property Value: The appraised value or purchase price, lenders typically use the lower of the two to stay conservative
Example:
- Loan Amount = $750,000
- Property Value = $1,000,000
- LTV = 75%

What It Means:
LTV indicates how much of the property is being financed with debt versus equity:
- Higher LTV = Greater leverage and more lender risk
- Lower LTV = More borrower equity and financial cushion
Commercial real estate lenders typically target 65%–75% LTV, although tolerance may vary by asset type, sponsor strength, and market cycle.
Pro Tip
High LTVs may trigger:
- Higher interest rates
- Personal guarantees or recourse provisions
- Stricter DSCR or LTC requirements
To optimize financing terms, sponsors often aim for a balanced LTV that protects downside risk without over-leveraging the asset.
Net Operating Income (NOI)
Description
Net Operating Income (NOI) is a core commercial real estate (CRE) metric that measures a property’s income after operating expenses but before financing costs and taxes. It represents the asset’s true earning power and is critical to valuation, underwriting, and performance analysis.
Use Case
NOI is the backbone of real estate investment analysis. It is used to:
- Determine a property’s value via Cap Rate
- Evaluate debt coverage capacity (DSCR)
- Compare operating performance across assets
- Support underwriting for acquisition, refinancing, or disposition
NOI is especially important when evaluating stabilized income-producing properties.
Formula:
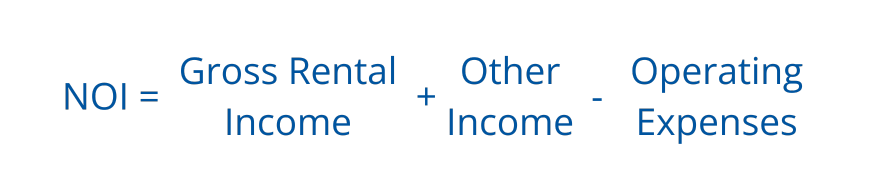
Where:
- Gross Rental Income: Base rent collected from tenants
- Other Income: Additional revenue from sources such as parking, laundry, vending, or storage fees
- Operating Expenses: Includes property taxes, insurance, repairs, utilities, and management—but excludes debt service, depreciation, and capital expenditures
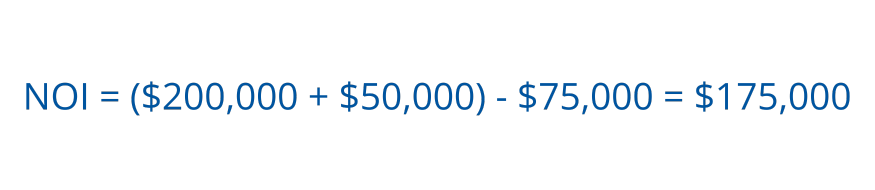
Example:
- Gross Rental Income: $200,000
- Other Income: $50,000
- Operating Expenses: $75,000
- NOI = $175,000
What It Means:
NOI is the pure operating income generated by a property before leverage is applied. It’s used by both investors and lenders to:
- Evaluate property-level profitability
- Measure operating efficiency
- Determine loan sizing and risk exposure
A higher NOI supports a higher valuation, stronger DSCR, and better overall return metrics.
Pro Tip
Always use stabilized and recurring income and expenses when calculating NOI. Avoid including one-time revenues or capital expenses to ensure consistency and comparability across deals.
Net Present Value (NPV)
Description
Net Present Value (NPV) calculates the current value of future cash flows generated by a real estate investment, minus the initial investment. It shows whether the projected income stream meets or exceeds the required rate of return based on time and risk.
Use Case
NPV is one of the most powerful tools in real estate financial modeling. It’s used to:
- Evaluate if an investment meets the required return (discount rate)
- Compare projects with different timelines or cash flow profiles
- Incorporate the time value of money (a dollar today is worth more than a dollar tomorrow)
- Assess development, value-add, and stabilized acquisition opportunities using discounted cash flow (DCF) analysis
Formula:

Where:
- Ct = Cash flow at time t
- r = Discount rate (required rate of return)
- t = Time period (1, 2, 3, …, n)
- C0 = Initial investment (usually a negative value)
- n = Total number of periods
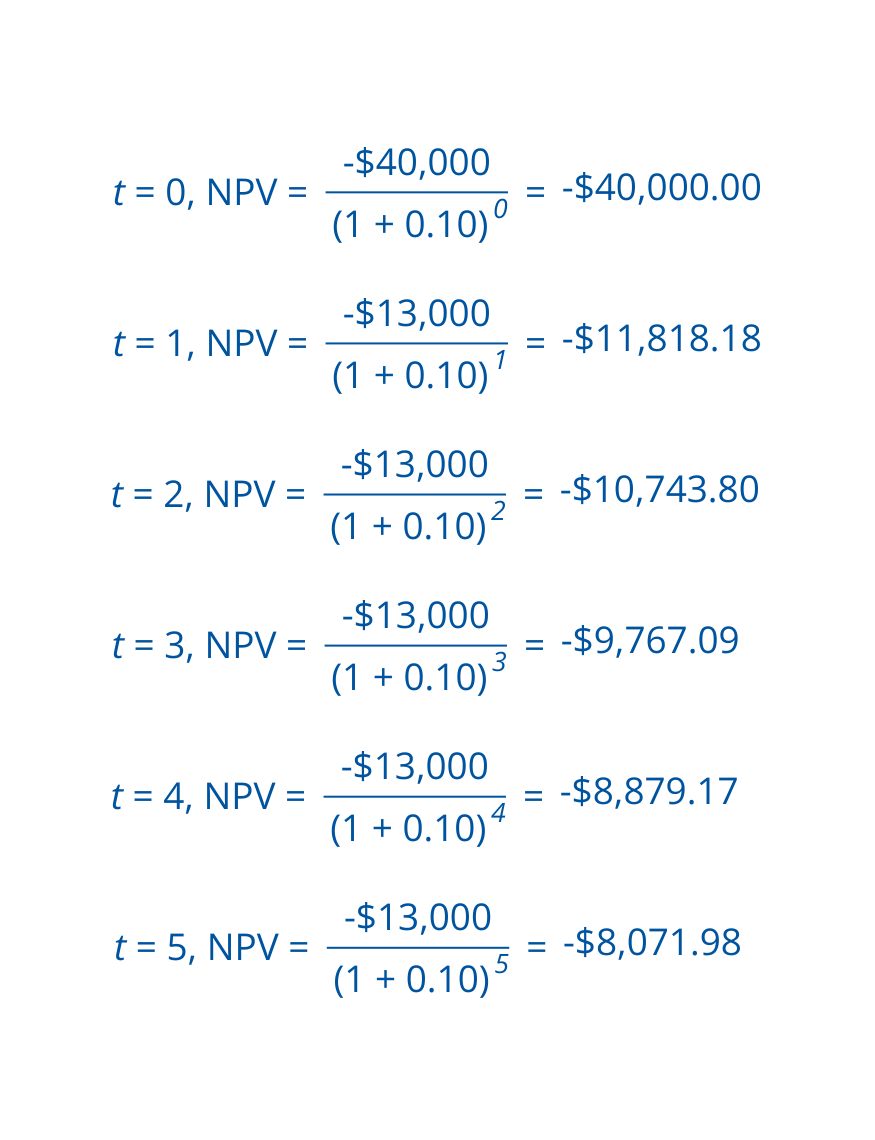
Example:
- Initial Investment (C₀): –$40,000
- Annual Cash Flow (Ct): $13,000 for 5 years
- Discount Rate (r): 10%
- NPV ≈ $9,280.22 (positive = value-creating investment)
What It Means:
NPV helps you determine whether an investment creates or destroys value in today’s dollars:
- NPV > 0 → The investment exceeds your required return — it’s value-accretive
- NPV = 0 → The investment just meets your return threshold — break-even
- NPV < 0 → The investment falls short of return expectations — value-destructive
Pro Tip
NPV is especially useful for risk-adjusted decision-making. Use it in tandem with IRR to understand both the scale and rate of return, and to evaluate exit strategies, lease-up timing, and cash flow volatility.
Operating Expense Ratio (OER)
Description
The Operating Expense Ratio (OER) measures the percentage of effective gross income (EGI) that is consumed by operating expenses. It provides a snapshot of how efficiently a property is being managed — and how much income is retained as potential profit.
Use Case
OER is commonly used to:
- Benchmark a property’s cost efficiency against industry norms
- Evaluate whether expenses are too high for the asset type or location
- Compare operating performance across portfolios or market segments
- Support asset management decisions around expense control
Lenders and asset managers use OER to flag high-cost properties during underwriting and performance audits.
Formula:

Where:
- Operating Expenses: Recurring costs to operate the property — e.g., taxes, insurance, repairs, property management. ( Does not include debt service, depreciation, or capital expenditures.)
- Effective Gross Income (EGI): Income after accounting for vacancy loss and adding other revenue sources like parking or storage.
Example:
- Operating Expenses = $45,000
- EGI = $150,000
- OER = 30%

What It Means:
OER shows how much of your revenue is consumed by operating costs:
- Lower OER = Better operating efficiency and higher income retention
- Higher OER = Greater expense burden, potentially reducing profitability
Typical OER ranges:
- Multifamily: 30–50%
- Office/Retail: 25–40%
- Industrial: Often lower, around 20–30%
(Note: These vary by market and property class)
Pro Tip
Track OER over time to catch cost creep and compare it to market benchmarks. Properties with high OERs may benefit from energy retrofits, vendor renegotiation, or outsourced management reviews.
Profitability Index (PI)
Description
The Profitability Index (PI) is a capital budgeting ratio that compares the present value (PV) of future cash flows to the initial investment. It tells you how much value is created per dollar invested, making it ideal for evaluating and comparing real estate deals of different sizes.
Use Case
PI is used by developers, fund managers, and institutional investors to:
- Measure capital efficiency
- Prioritize projects based on value created per dollar spent
- Compare multiple real estate investments when capital is limited
- Supplement NPV and IRR to refine investment selection
Especially helpful for portfolio optimization and capital allocation.
Formula:
Where:
- Present Value of Future Cash Flows: Total of all projected income and exit proceeds, discounted back using a risk-adjusted rate
- Initial Investment: Total upfront capital required, including acquisition, development, or renovation costs
Example:
- PV: $120,000
- Investment: $100,000
- PI = 1.2

What It Means:
PI tells you how much return you’re generating for every dollar invested:
- PI > 1.0: Profitable investment — value is being created
- PI = 1.0: Break-even — no value created or lost
- PI < 1.0: Value-destroying investment — below required return threshold
A PI of 1.2 means you’re generating $1.20 in value for every $1 invested.
Pro Tip
While PI doesn’t show scale (like NPV), it’s excellent for comparing capital efficiency across multiple projects. For capital-constrained investors, prioritizing deals by PI can maximize returns across a portfolio.
Return on Investment (ROI)
Description
Return on Investment (ROI) is a high-level profitability metric that measures the total return generated from a real estate investment relative to the total capital invested. Expressed as a percentage, ROI captures income + appreciation, making it useful for evaluating overall performance over the life of an investment.
Use Case
ROI is most often used to
- Measure total profit earned from an investment (not just annual income)
- Compare real estate performance to stocks, bonds, or other asset classes
- Evaluate combined gains from rental income, sale proceeds, and tax benefits
While it lacks time sensitivity, ROI provides a comprehensive snapshot of return on equity.
Formula:

Where:
- Net Profit: Total gains after selling or operating the property — includes rental income, resale value, and any tax advantages, minus costs like purchase price, improvements, fees, and selling expenses
- Total Investment: The full amount of capital invested, including down payment, closing costs, rehab costs, and other upfront expenses
Example:
- Net Profit: $60,000
- Total Investment: $300,000
- ROI = 20%

What It Means:
ROI tells you the total return on your invested equity, but without factoring in time, cash flow timing, or compounding.
- High ROI indicates strong investment performance
- Unlike Cash-on-Cash Return (CoC), ROI can capture equity growth, forced appreciation, and exit gains
- Best used after a project concludes, or to evaluate a full-hold lifecycle in long-term investment planning
Pro Tip
Use ROI together with IRR or Equity Multiple for a more complete picture. ROI is simple and intuitive but may miss time-based risk and return patterns that are critical in real estate investing.
Yield on Cost (YOC)
Description
Yield on Cost (YOC) is a core real estate development metric that measures the stabilized return on investment based on the total cost to develop or acquire a property, not its market value. It helps investors understand the income yield relative to project cost, especially before full stabilization.
Use Case
Yield on Cost is essential for evaluating whether a development, repositioning, or value-add project is financially attractive compared to existing market opportunities.
It’s a key performance indicator (KPI) for:
- Real estate developers evaluating ground-up or redevelopment feasibility
- Investors comparing new construction to stabilized acquisitions
- Sponsors seeking to demonstrate margin creation or forced appreciation
Formula:
Where:
- Net Operating Income (NOI): The projected or actual stabilized annual income from the asset after operating expenses but before debt service.
- Total Project Cost: Includes all development, acquisition, renovation, soft costs, and financing expenses incurred to deliver the assets to stabilized operations.
Example:
- Stabilized NOI: $900,000
- Total Project Cost: $10,000,000
- YOC = 9%

What It Means:
Yield on Cost provides a real-time profitability snapshot for developers and value-add investors — before a property reaches market stabilization or sale.
- If YOC > Market Cap Rate, the project is generating above-market yield, indicating value creation and equity upside.
- If YOC < Cap Rate, the asset may be overbuilt or overfunded, offering little margin.
- YOC is most useful for underwriting in ground-up developments, adaptive reuse, lease-up properties, and repositioning plays.
Pro Tip
Benchmark the YOC against prevailing cap rates in the same asset class and submarket. A 150–250 basis point spread is often used by institutional investors as a target for development return thresholds.